This page was generated from notebooks/0D-Mass.ipynb.
Mass estimation
First we need some imports.
[1]:
%load_ext autoreload
%autoreload 2
[2]:
import numpy as np
from scipy import stats
import pylab as plt
import torch
import torchist
import swyft
Training data
Now we generate training data. As simple example, we consider the model
where the parameter \(z \sim \mathcal{N}(\mu = 0, \sigma = 1)\) is standard normal distributed, and \(\epsilon \sim \mathcal{N}(\mu = 0, \sigma = 0.1)\) is a small noise contribution. We are interested in the posterior of \(z\) given a measurement of parameter \(x\).
[3]:
N = 100000  # Number of samples
z = np.random.rand(N, 3)*2 - 1
r = (z[:,0]**2 + z[:,1]**2)**0.5
x = r.reshape(N, 1) + np.random.randn(N, 1)*0.1
Training data that is kept in memory is stored in a swyft.Samples object.
[4]:
samples = swyft.Samples(x = x, z = z)
Inference network
The inference network is an instance of swyft.SwyftModule. It estimates ratios of the form
where \(A\) and \(B\) refer to any subset of variables in the training data. In the below example, we set \(A \to x\) and \(B \to z\).
We use here a standard dense network, swyft.RatioEstimatorMLP1d, for mapping \(x\) and \(z\) onto a ratio estimator object.
[5]:
class Network(swyft.SwyftModule):
    def __init__(self):
        super().__init__()
        marginals = ((0, 1),)
        self.logratios1 = swyft.LogRatioEstimator_1dim(num_features = 1, num_params = 3, varnames = 'z')
        self.logratios2 = swyft.LogRatioEstimator_Ndim(num_features = 1, marginals = marginals, varnames = 'z')

    def forward(self, A, B):
        logratios1 = self.logratios1(A['x'], B['z'])
        logratios2 = self.logratios2(A['x'], B['z'])
        return logratios1, logratios2
Trainer
Training is now done using the SwyftTrainer class, which extends pytorch_lightning.Trainer by methods like infer (see below).
[6]:
trainer = swyft.SwyftTrainer(accelerator = 'gpu', gpus=1, max_epochs = 1, precision = 64)
/home/weniger/miniconda3b/envs/zero/lib/python3.9/site-packages/pytorch_lightning/trainer/connectors/accelerator_connector.py:446: LightningDeprecationWarning: Setting `Trainer(gpus=1)` is deprecated in v1.7 and will be removed in v2.0. Please use `Trainer(accelerator='gpu', devices=1)` instead.
  rank_zero_deprecation(
GPU available: True (cuda), used: True
TPU available: False, using: 0 TPU cores
IPU available: False, using: 0 IPUs
HPU available: False, using: 0 HPUs
The swyft.Samples class provides convenience functions to generate data loaders for training and validation data.
[7]:
dl_train = samples[:2000].get_dataloader(batch_size = 512, shuffle = True)
dl_valid = samples[2000:4000].get_dataloader(batch_size = 512)
WARNING: Deprecated
WARNING: Deprecated
[8]:
network = Network()
[9]:
trainer.fit(network, dl_train, dl_valid)
/home/weniger/miniconda3b/envs/zero/lib/python3.9/site-packages/pytorch_lightning/callbacks/model_checkpoint.py:616: UserWarning: Checkpoint directory /home/weniger/codes/swyft/notebooks/lightning_logs/version_10053910/checkpoints exists and is not empty.
  rank_zero_warn(f"Checkpoint directory {dirpath} exists and is not empty.")
LOCAL_RANK: 0 - CUDA_VISIBLE_DEVICES: [0]

  | Name       | Type                   | Params
------------------------------------------------------
0 | logratios1 | LogRatioEstimator_1dim | 52.2 K
1 | logratios2 | LogRatioEstimator_Ndim | 17.5 K
------------------------------------------------------
69.7 K    Trainable params
0         Non-trainable params
69.7 K    Total params
0.558     Total estimated model params size (MB)
/home/weniger/miniconda3b/envs/zero/lib/python3.9/site-packages/pytorch_lightning/trainer/connectors/data_connector.py:219: PossibleUserWarning: The dataloader, val_dataloader 0, does not have many workers which may be a bottleneck. Consider increasing the value of the `num_workers` argument` (try 24 which is the number of cpus on this machine) in the `DataLoader` init to improve performance.
  rank_zero_warn(
/home/weniger/miniconda3b/envs/zero/lib/python3.9/site-packages/pytorch_lightning/trainer/connectors/data_connector.py:219: PossibleUserWarning: The dataloader, train_dataloader, does not have many workers which may be a bottleneck. Consider increasing the value of the `num_workers` argument` (try 24 which is the number of cpus on this machine) in the `DataLoader` init to improve performance.
  rank_zero_warn(
/home/weniger/miniconda3b/envs/zero/lib/python3.9/site-packages/pytorch_lightning/trainer/trainer.py:1894: PossibleUserWarning: The number of training batches (4) is smaller than the logging interval Trainer(log_every_n_steps=50). Set a lower value for log_every_n_steps if you want to see logs for the training epoch.
  rank_zero_warn(
`Trainer.fit` stopped: `max_epochs=1` reached.
Coverage tests
We first generate some prior samples.
[10]:
samples_prior = swyft.Samples(z = np.random.rand(10000, 3)*2-1)
Then we can use the test_coverage method to estimate the probability mass contained in the smallest highest-likelihood regions that contain the true parameter.
[11]:
coverage_samples = trainer.test_coverage(network, samples[-500:], samples_prior)
WARNING: This estimates the mass of highest-likelihood intervals.
WARNING: Deprecated
WARNING: Deprecated
LOCAL_RANK: 0 - CUDA_VISIBLE_DEVICES: [0]
/home/weniger/miniconda3b/envs/zero/lib/python3.9/site-packages/pytorch_lightning/loops/epoch/prediction_epoch_loop.py:173: UserWarning: Lightning couldn't infer the indices fetched for your dataloader.
  warning_cache.warn("Lightning couldn't infer the indices fetched for your dataloader.")
WARNING: Deprecated
WARNING: Deprecated
LOCAL_RANK: 0 - CUDA_VISIBLE_DEVICES: [0]
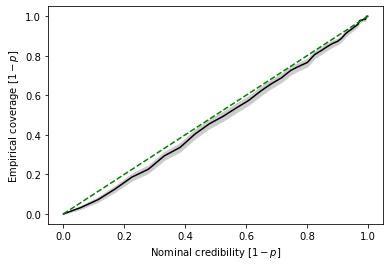
Based on these estimates, we can produce then the standard P-P plot. Here, \(p\) corresponds to the probability mass outside the highest-likelihodo regions. We here plot \(1-p\), in order to move the credible regions with the highest credibility to the upper right corner.
[13]:
swyft.plot_pp(coverage_samples, "z[0]")
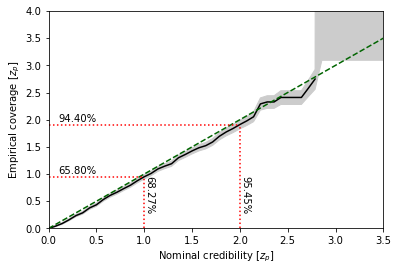
In P-P plots, regions with high credibility (\(1-p = 68.3\%, 95.5\%, 99.7\%\) etc) become increasingly hard to interpret. Swyft also provides functionality to directly plot the corresponding \(z_p\) values (\(z_p = 1.0, 2.0, 3.0\) etc).
[14]:
swyft.plot_zz(coverage_samples, "z[0]")
[ ]:
This page was generated from notebooks/0D-Mass.ipynb.